Chris @ Botany 2024

Presentations
- Poster: Monday, June 17th
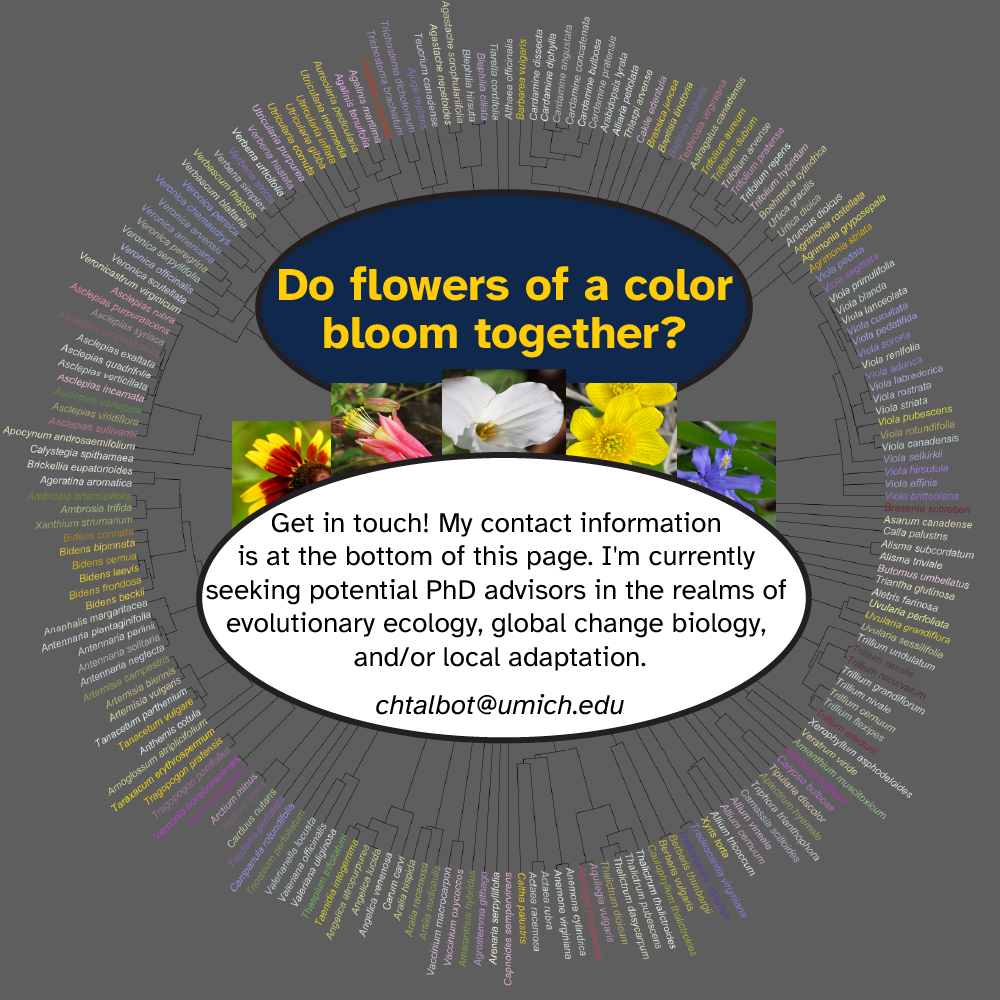
- 6:15pm-7:00pm, Exhibit Hall, #102 – All Society Poster Session
- View the poster here!
- Lightning Talk: Wednesday, June 19th
- 1:55pm-2:00pm, Gallery Overlook A – Germinating Ideas
- View the slides here!
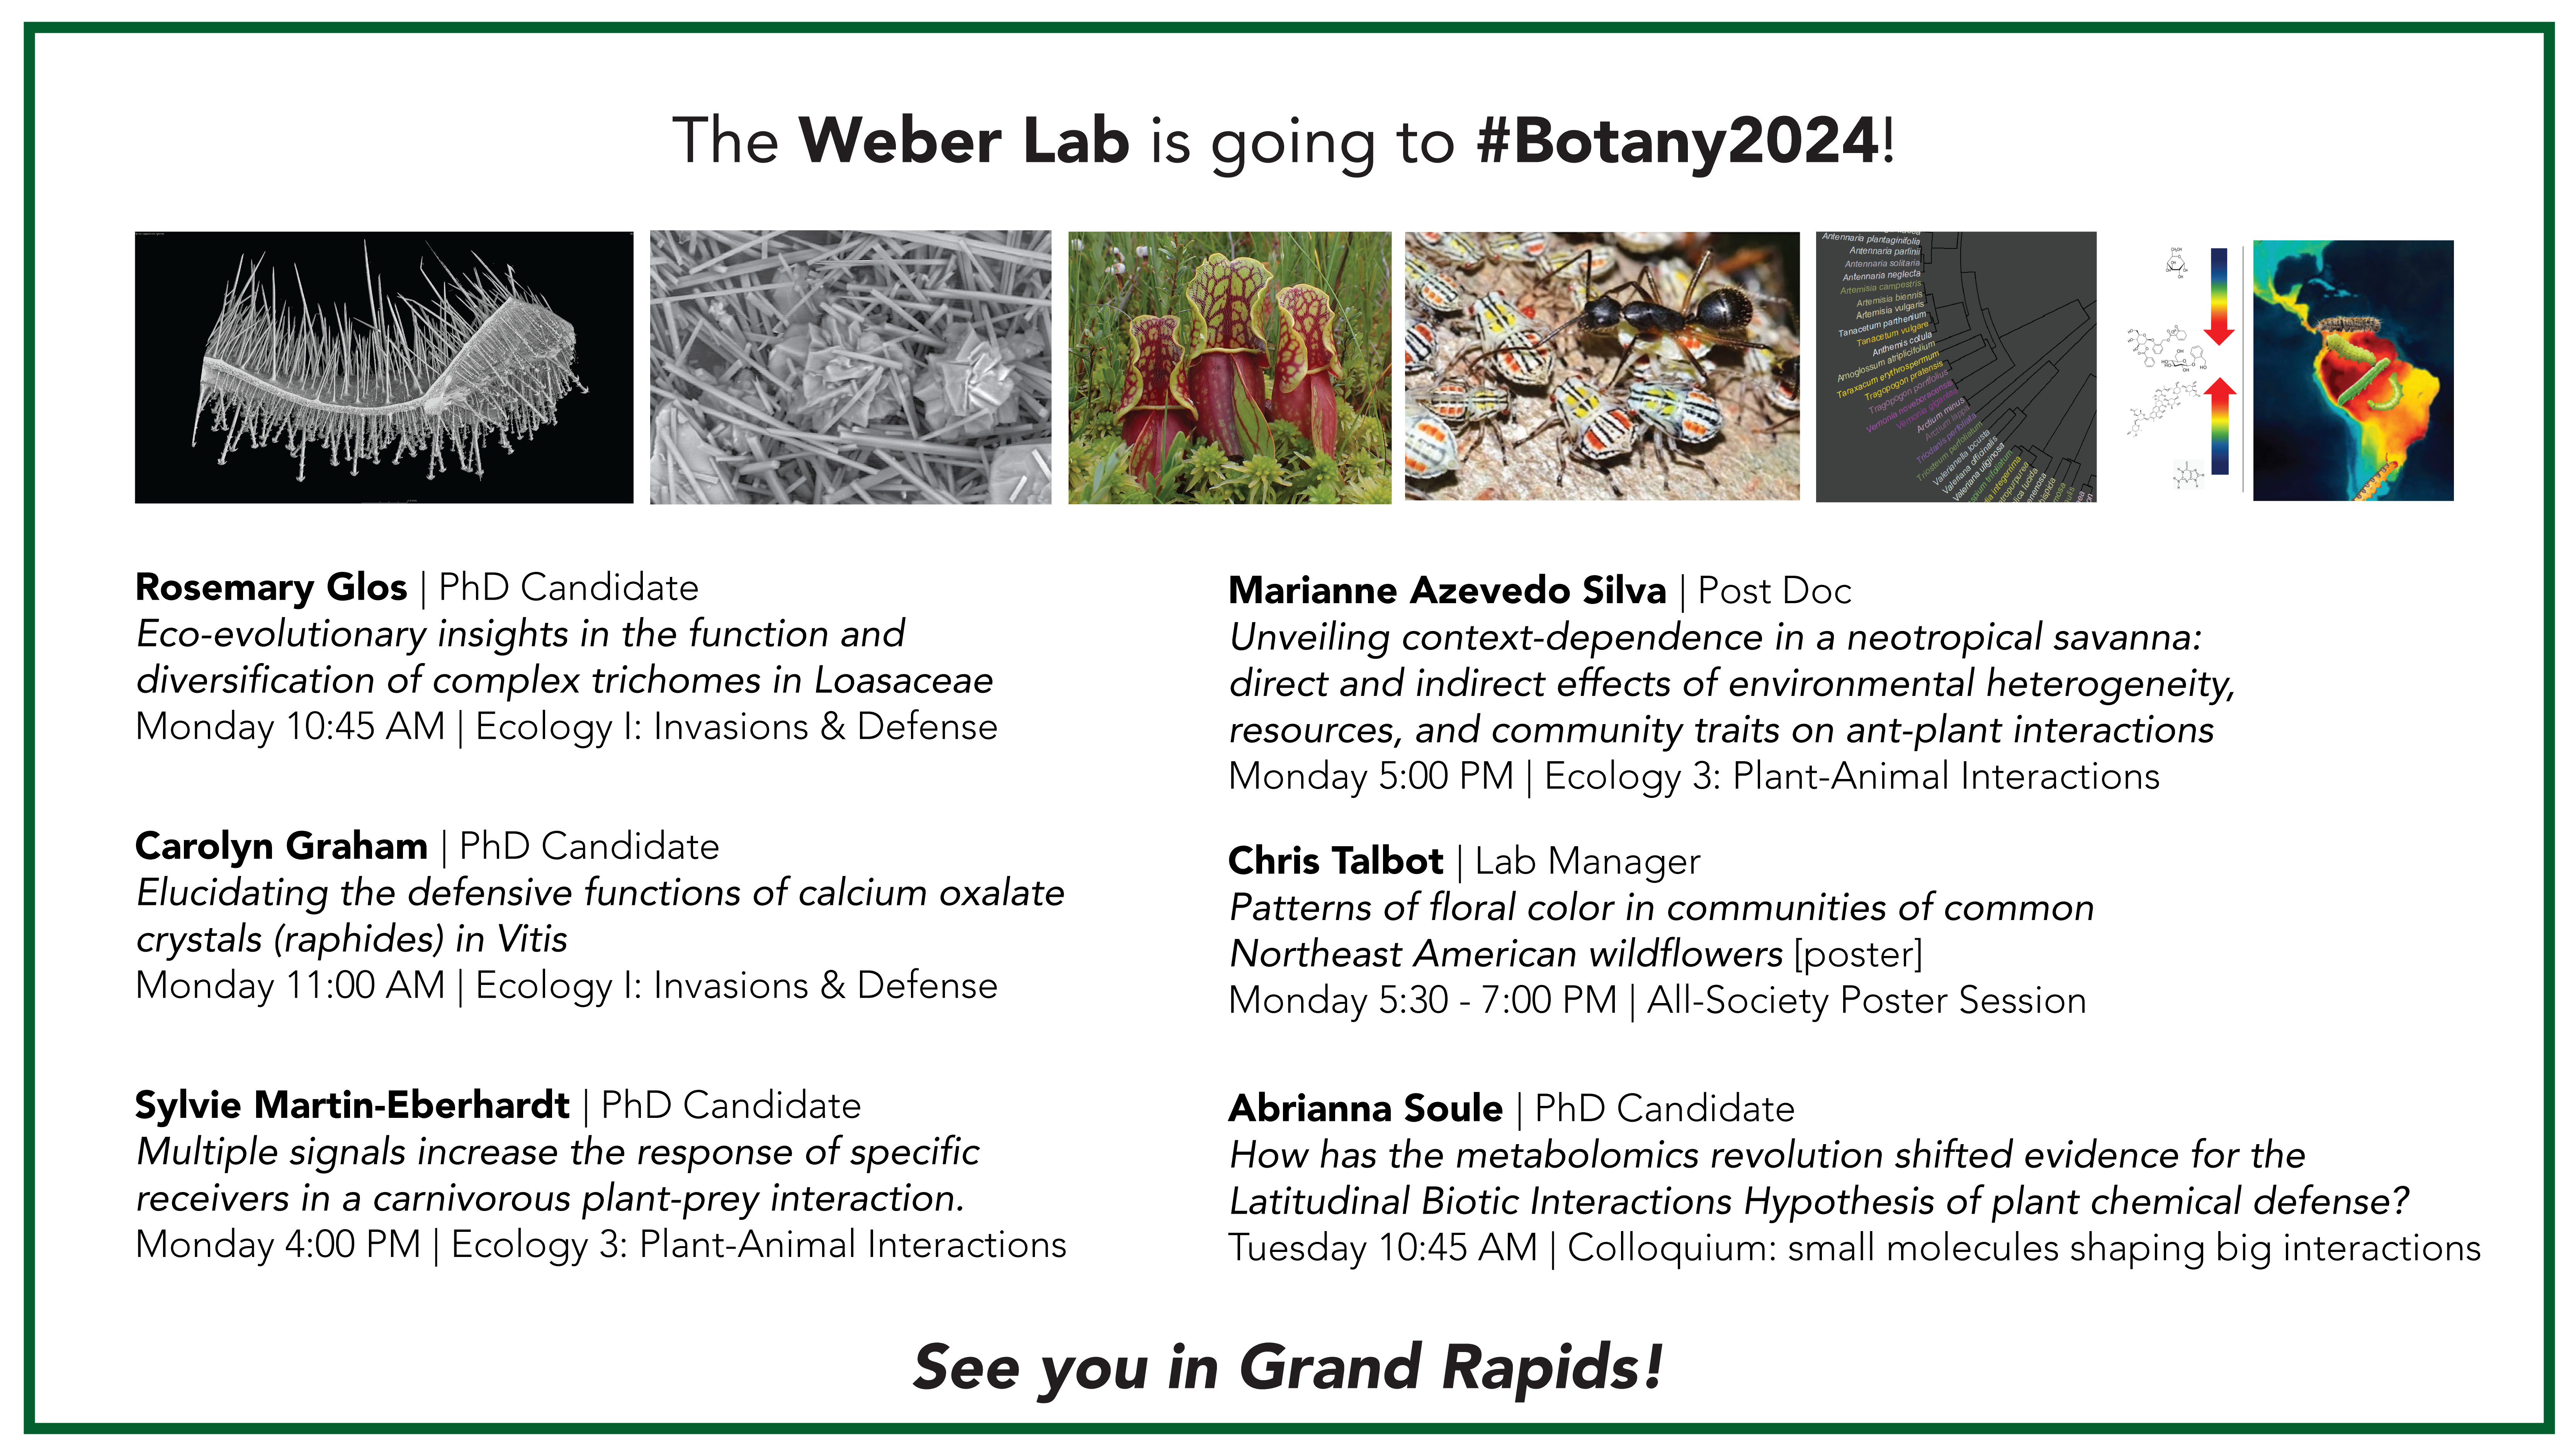
Be sure to catch the rest of the Weber Lab at Botany, too! Thanks to Rosy for this awesome flyer.

Supplemental information
Q1: How was the floral color data collected?
A: A k-means clustering algorithm, hand-trained for each species using a custom GUI, ran on up to 100 research-grade images from iNaturalist. Coded in Python, and adapted from Perez-Udell et al., 2019. Find the GUI and algorithm on my GitHub here. Floral color data is initially calculated as the average color value in HSV space for the most common floral color of a given species.
Q2: How was the range data collected?
A: GBIF occurrences, 1960 and later, isolated to North America, and filtered to exclude erroneous occurrences of various sorts. Representing North America as a raster of 10km2 cells, cells were populated with presence data based on the existence of an occurrence within that cell. This range format exhibits similar accuracy to convex hulls and buffered points, while offering higher computational speeds.
Q3: Where is the phylogeny from?
Q4: How was co-occurrence calculated?
A: Frequency of co-occurrence between two species was calculated using the overlap (Szymkiewicz–Simpson) coefficient, calculated from our cell-based presence data as follows, where \(A\) and \(B\) are the set of cells occupied by species \(a\) and \(b\) respectively:
\[ overlap_{a,b} = \frac{|A \cap B|}{min(|A|, |B|)} \]
Q5: How was floral color (dis)similarity calculated?
A: Floral color for each species was transformed into HSL space. Floral color dissimilarity was calculated as the Euclidean distance between colors in HSL space:
color_dis <- dist(hsl_data, method = "euclidean")Floral color similarity was calculated for each pair of species \((a,b)\) as:
\[ similarity_{a,b} = max(color\_dis) - color\_dis_{a,b} \]
Q6: What about pollinator vision? The UV spectrum?
A: Floral color data is restricted to camera color vision due to the number of species for which color data was required. Exploring this pattern at such large scales using spectral data would be an exciting avenue for future research.
[Coming soon: figures on relatedness~overlap, and any other relationships that may be of interest from the current data]
Fun figures
[Coming soon: GIF of floral color across range through time]
Contact info
View my CV here!
- Email: chtalbot@umich.edu
- GitHub: @chris-a-talbot
Social media:
- Twitter: @chris__talbot
- LinkedIn: @chris-talbot
- BlueSky: @chtalbot